CoNGA: Deciphering the dance of T-cell differentiation

By creating neighborhoods that group T cells by their T-cell receptor sequence and gene expression researchers can learn more about their function. (Illustration by Hudd Byard)
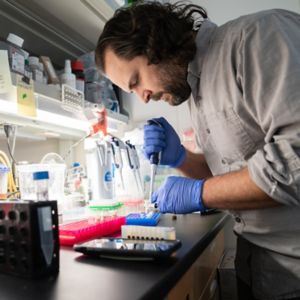
Human bodies are made up of trillions of cells. As technology has advanced, scientists have gained the ability to study different aspects of single cells. At St. Jude, we often use a technology called single-cell RNA sequencing to look at the expression of genes. When you do this analysis on thousands of cells, you can create clusters of cells with similar gene-expression profiles.
I’m a scientist in the laboratory of Paul Thomas, PhD, where a lot of our work focuses on T cells. The T-cell receptor is the “business” part of the cell. It's what the T cell uses to visualize its antigen, the molecule that the immune system recognizes as being out of place, for example from a virus or tumor. Every T cell has a unique receptor it uses to see and respond to its antigen.
Through work done in our lab, we’ve learned that T cells recognizing the same antigens tend to have similar T-cell receptor sequences. We developed methods for quantifying how similar they are. Using single-cell RNA sequencing, we are able to measure the gene expression and determine the receptor sequences for thousands of T cells simultaneously. Although methods already exist for analyzing gene expression, we lacked tools for systematically analyzing the T-cell receptor data and the gene-expression data simultaneously to find patterns.
Information about T-cell receptor sequence and gene expression are different types of data, but we needed a tool for identifying T cells where these two features correlated. To compare them efficiently, we created an algorithm, which we call clonotype neighbor graph analysis, or CoNGA. Recently published in Nature Biotechnology, CoNGA allows us to create neighborhoods to group cells based on the T-cell receptor sequence and their gene-expression profile.
Getting to know your neighbors
If you've got two different types of data and you want to consider them at the same time, how do you do that efficiently? Our approach quantifies T-cell receptor information and groups cells with similar sequence features into neighborhoods. On the other side, for gene expression, we group cells near each other that have similar profiles and put cells far away from each other that are dissimilar. Based on these, we can assign each cell its closest neighbors in either T-cell receptor or gene-expression space.
“Imagine that I'm a cell on a map,” Thomas explains. “If I'm a cell in Hawaii, my nearest neighbor might be in California because there are no other cells around me. But if I’m a cell in California, there's no way that my nearest neighbor is in Hawaii. That Hawaiian cell isn’t going to be part of my neighborhood.”
With CoNGA we draw two maps with our T cells: one where they are grouped by their gene expression and another by their T-cell receptor. Then, we identify which cells are forming neighborhoods in both of these maps. Looking at cells in this way, we’re able to identify groups of cells that share features of their T-cell receptors as well as their gene expression. From this we can start to draw conclusions about how the cells might be related and how they may function. We can also look for specific features, to see if a particular neighborhood of cells has high expression of a certain gene and compare it to other neighborhoods.
Learning from the neighborhood
We’ve known that T-cell receptors that perform similar functions tend to reside in the same neighborhood—for example, the T-cell receptors that respond to a particular flu antigen. However, through CoNGA we’ve found that they're also close to each other in gene expression. It makes sense that T-cell receptors with a similar function would share features of their gene-expression programs, since they’re called on to do the same thing, but this was never obvious before.
It is still technically difficult to define all the T-cell receptors that see a particular antigen. But with CoNGA, we know the T cells that see a particular antigen are also going to be found together in their gene-expression neighborhood. If cells in that gene-expression space have T-cell receptors whose function we don't know, we can infer they probably share a similar function and are targeting a similar antigen.
We can now apply this to diverse problems. For example, although we have just begun to define T-cell populations that respond to SARS-CoV-2, the virus that causes COVID-19, we can use CoNGA to learn more. It provides a “shortcut” that we can use to implicate all the other cells we see with similar gene-expression patterns to the few that we know are SARS-CoV-2 specific.
CoNGA has already identified novel types of T cells, but as datasets continue to become larger and more complicated CoNGA will help us learn about the interplay between T-cell specificity and function across different disease states. CoNGA is not limited to just T cells, either. We’ve recently added support for B cell analysis, which we hope will aid in identifying which cells are making antibodies against the same antigens.
Single-cell–based analysis is rapidly becoming the standard for research into T-cell receptor biology and gene expression. We'll be applying CoNGA to the work we’re doing in the Thomas lab, and wanted to make this tool available to other researchers, too. CoNGA is open source and works with other standard tools used for analyzing these types of data, so it can be easily implemented by researchers around the world.
About the author